

Timeline
When will this be released?
Wednesday, 04/29/2026 at 3 PM PST
Is there downtime for this release?
No
Recruitment Reports Enhancements
As part of this release, two essential data fields have been incorporated into Report Builder to enhance visibility into the recruitment pipeline and internal operations. These additions are intended to optimize workload management and centralize candidate feedback, thereby ensuring reports provide a more comprehensive perspective on the hiring process.
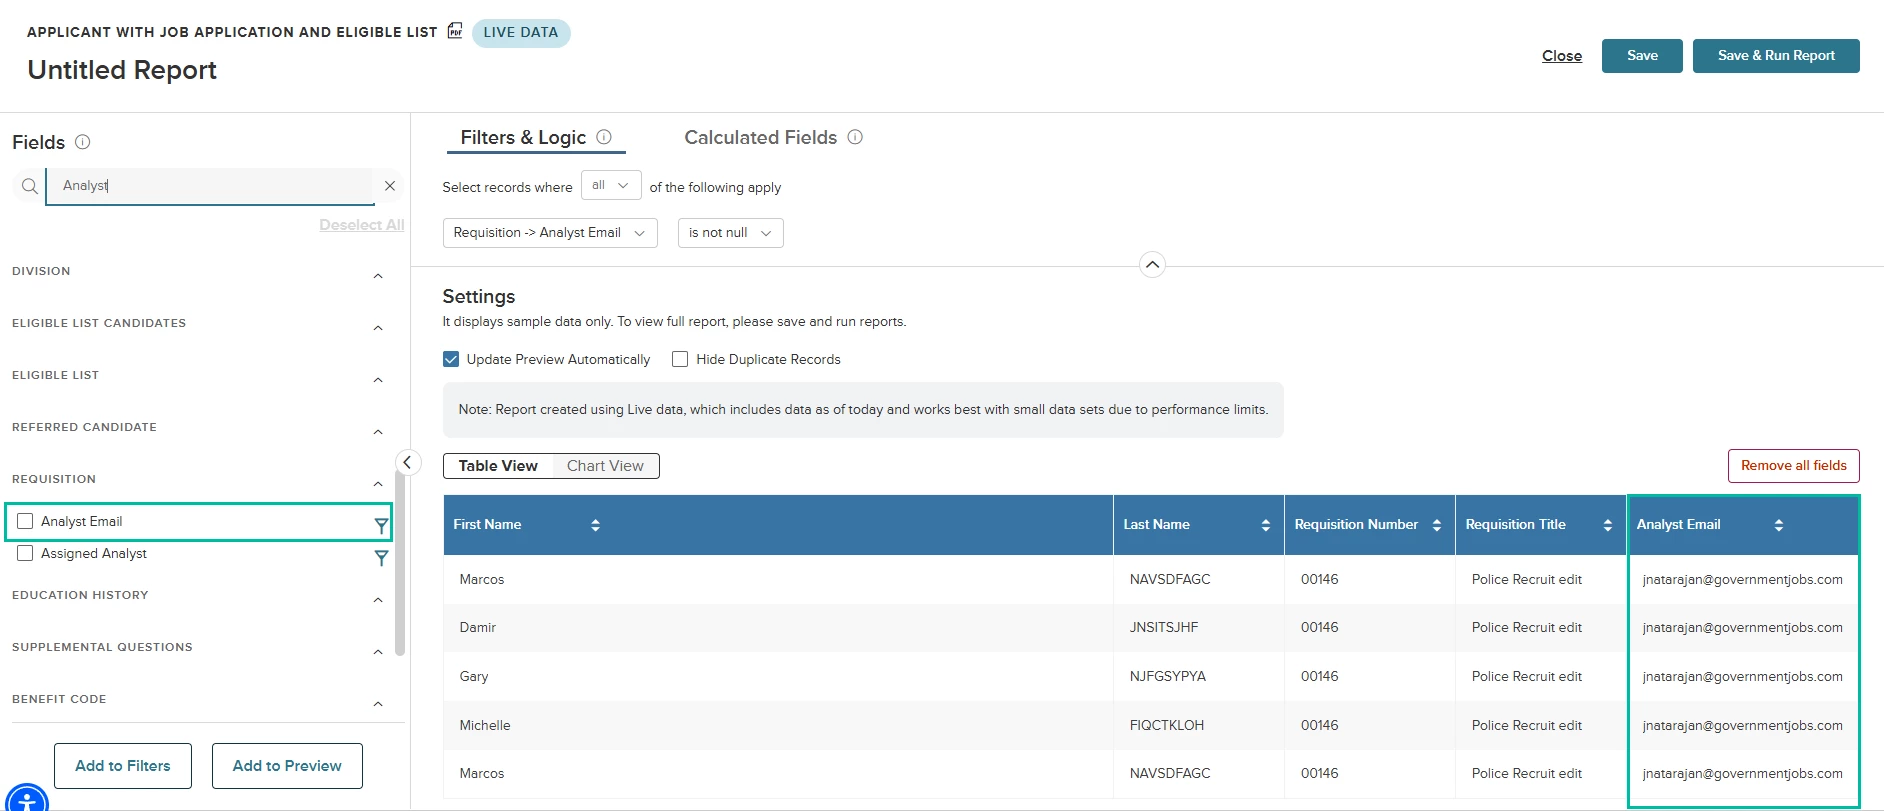
Analyst Email Field
We've added the new Analyst Email field to Report Builder, allowing you to filter, display, and analyze all analysts in your agency—including those not currently assigned to a requisition. This enhancement improves analyst workload management and ensures comprehensive reporting.
You can add the Analyst Email field to the grid, calculated fields, or charts for the following reports:
- Applicant with Job Application and Eligible List
- Applicant With Referred List And Offers/Hires
- Applicants with Requisitions and Eligible List/Referred List/Offers/Hires
- Job Information
- OHC Evaluation Step Candidates
- Requisition Lifecycle
Filtering Note: Filter by Analyst Email using full email addresses, separated by commas (no spaces). If no analyst is assigned to a requisition, the field will be blank.
Value
Enables complete visibility and flexible filtering of all analysts, improving workflow management and reporting accuracy.
Audience
An Insight user with access to RB.
Example
A recruiter can filter reports to see all analysts in their agency, including those without active requisitions, for comprehensive workload tracking.
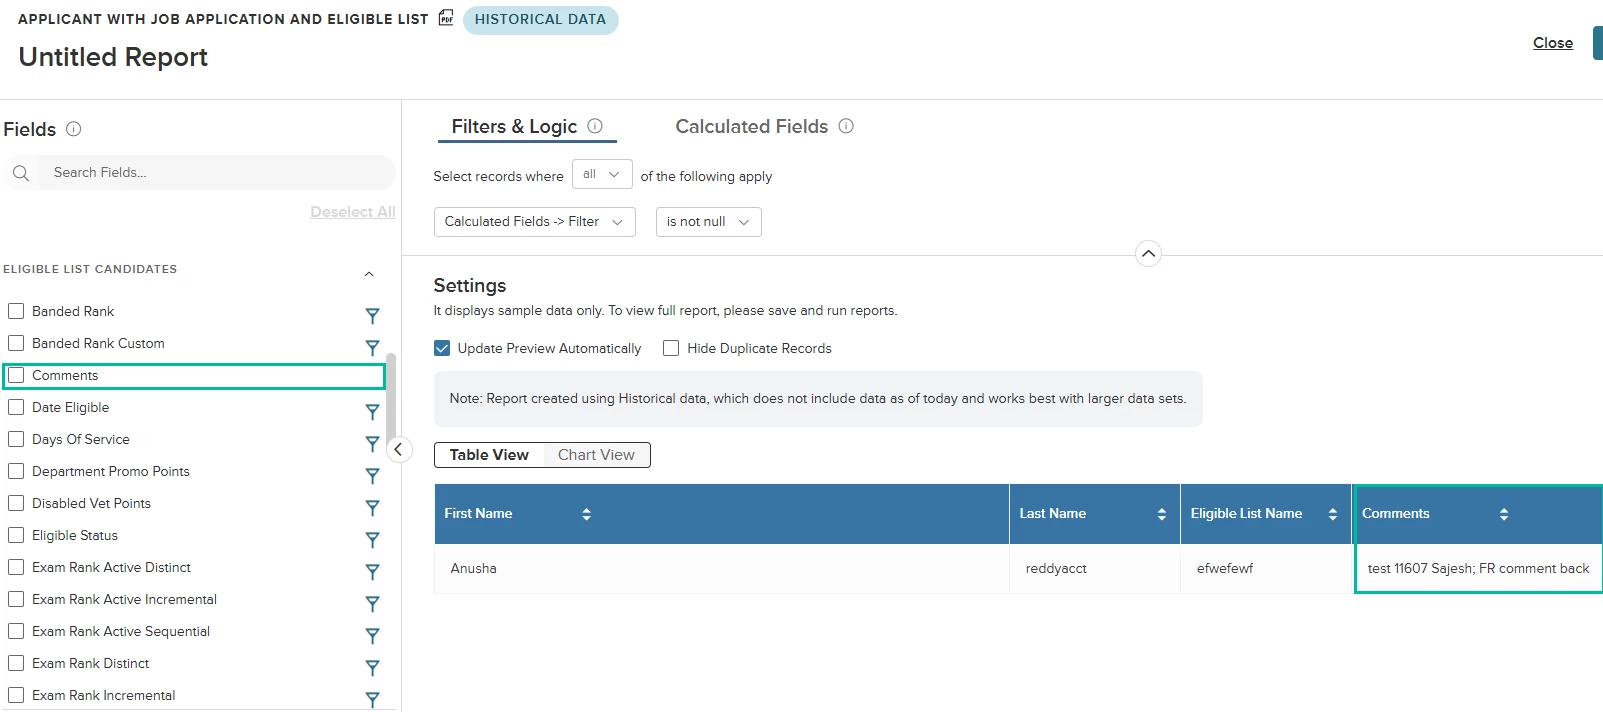
Eligible List Candidate Comments
You can now include candidate-level comments from the eligible list directly in your reports. This enhancement makes it easier to track and review candidate feedback by adding a comments field within several reports, allowing you to capture more context for each applicant.
A new field is available in the following reports under the Eligible List Candidate section:
- Applicant with Job Application and Eligible List
- Applicant with Referred List and Offers/Hires
- Applicants with Requisitions and Eligible List/Referred List/Offers/Hires
To include this field in your report, locate the Eligible List Candidate section in the report. Select and add the new Comments field to include candidate-level comments in your report output.
Value
Provides greater transparency and context by including candidate feedback in reports.
Audience
Insight users with access to Report Builder.
Example
A recruiter can view comments made about a candidate on the eligible list when generating a defined recruitment report.
Analytics Dashboards
This release expands the Analytics dashboard suite with two new dashboards, Class Activity and Instructor Activity, providing comprehensive analytics for training programs, including enrollment and completion rates.
We've also enhanced existing dashboards: the Onboard dashboard now offers expanded filtering options, and the HR Director dashboard includes a "Number of Vacancies" metric and a Bargaining Unit filter for better workforce planning. These updates collectively improve data visibility across agency training, onboarding and hiring.
Onboard Dashboard Enhancements
Easily tailor your onboarding analytics with new filters and fields on the Onboard dashboard, helping you focus on the data that matters most. Access expanded filtering options for both the New Hires and Task Status dashboards, allowing you to customize reports by hire date, position type, and task due date.
Changes for each dashboard are described below.
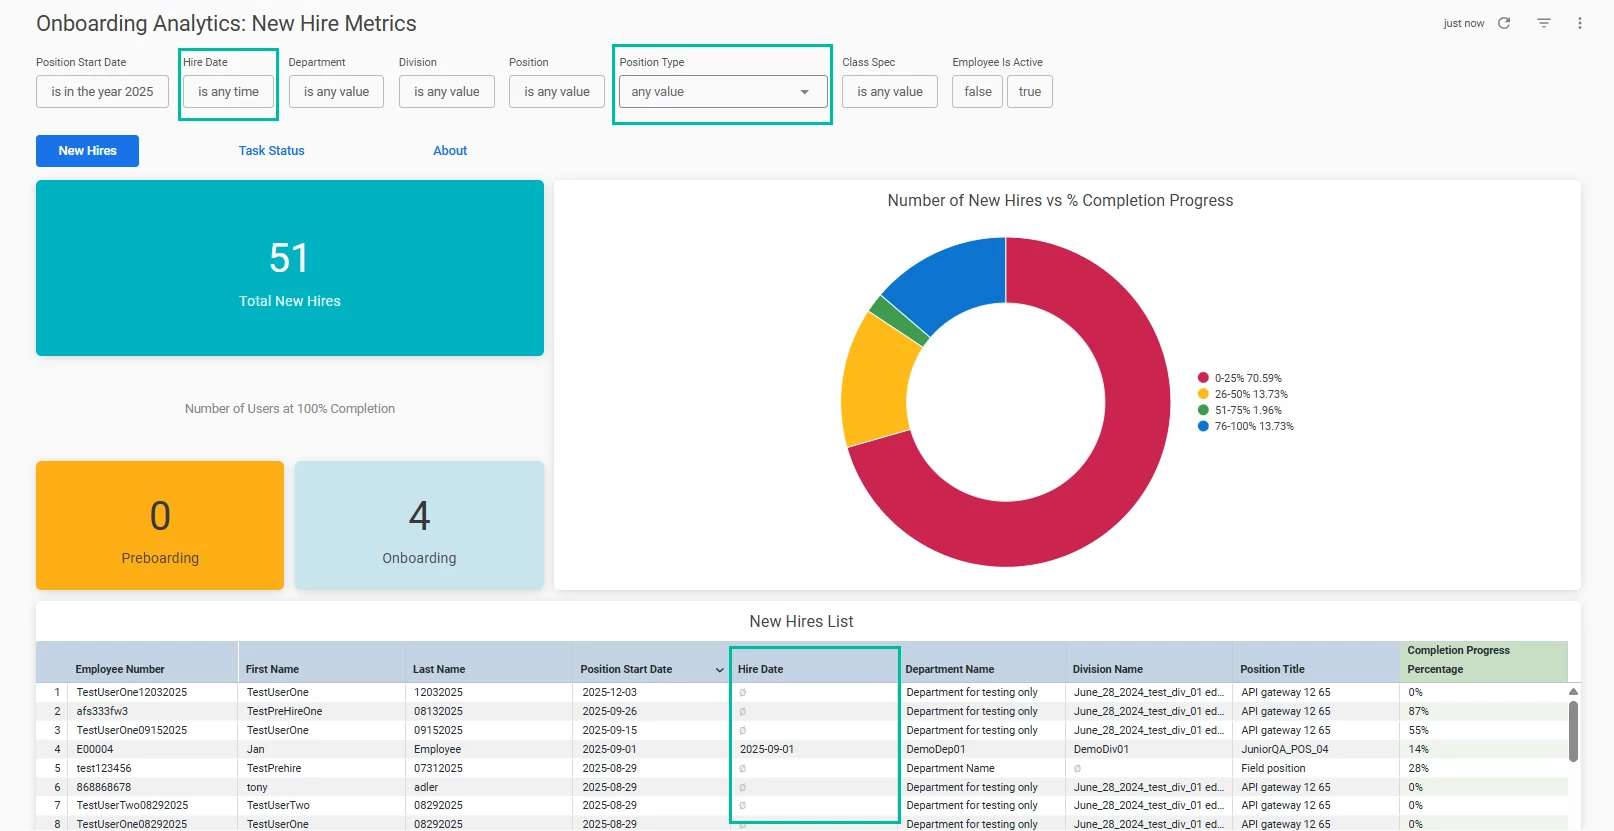
New Hires dashboard
Hire Date Field
- Added as a dashboard filter with a default value is any time.
- Added as a column on the New Hires List.
- Visible as a column on drill down.
Position Type Field
- Added as a dashboard filter with a default value is any value.
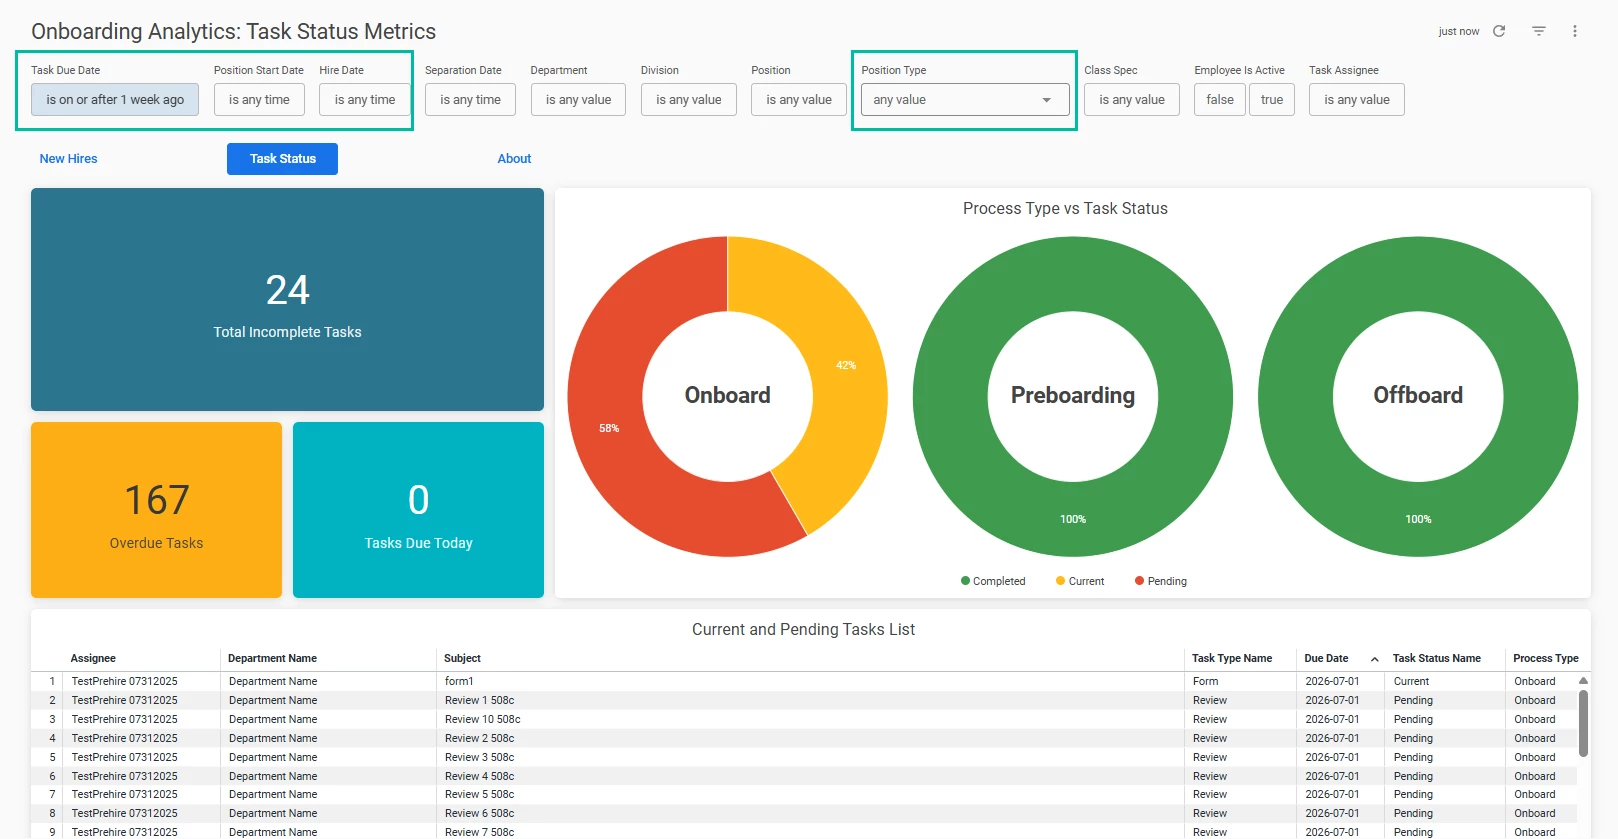
Task Status dashboard
- Added Task Due Date as a dashboard filter with a default value set to on or after 1 week.
- The default value for the Position Start Date filter has been changed to Any time.
- Added the Hire Date filter with a default value is any time.
- Added Position Type as a dashboard filter with a default value is any time.
Value
Empowers users to generate more relevant onboarding reports, supporting better decision-making and tracking.
Audience
Onboard users with Report Builder access.
Example
A recruiter filters the New Hires dashboard by position type and/or hire date to review recent hires for a specific department.
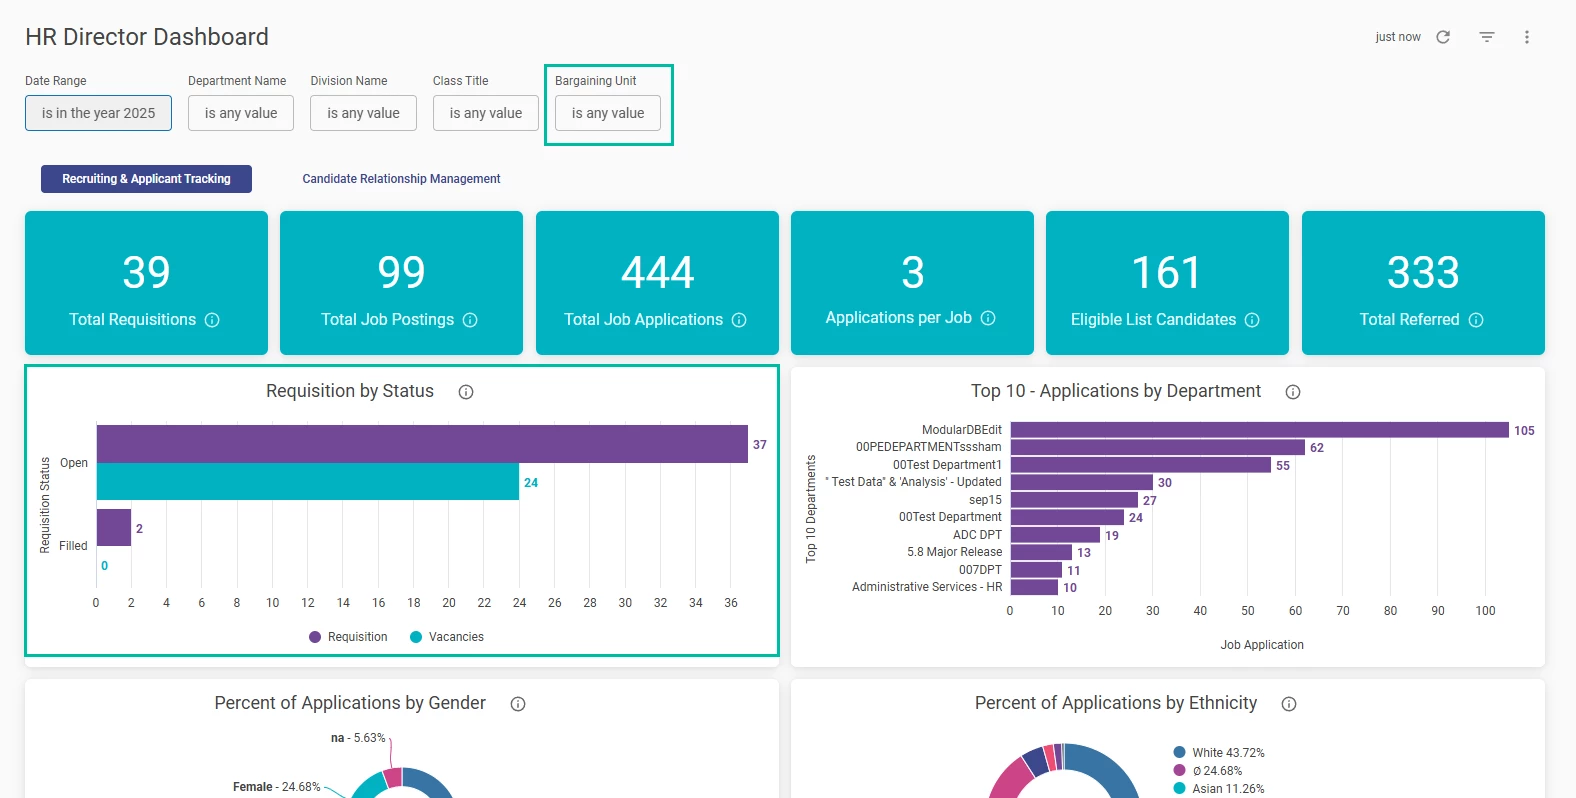
HR Director Dashboard Enhancements
This release introduces enhancements for easier and faster tracking of staffing demand.
The HR Director dashboard has been updated with changes to the Requisition by Status tile. This tile now displays the Number of Vacancies metric in addition to the existing requisition counts.
We’ve enhanced the filtering experience by introducing a Bargaining Unit filter at the top of the page. To ensure a more intuitive search, the Division filter is now dynamic: it will automatically filter its options based on the specific Departments you’ve selected (if no specific departments are selected, all available divisions will be displayed).
Value
Improves workforce planning decisions by showing vacancy volume by requisition status and enabling quick bargaining-unit filtering.
Audience
An Insight user with access to Report Builder.
Example
An HR Director compares “Open” requisitions to total vacancies to spot high-need statuses at a glance.
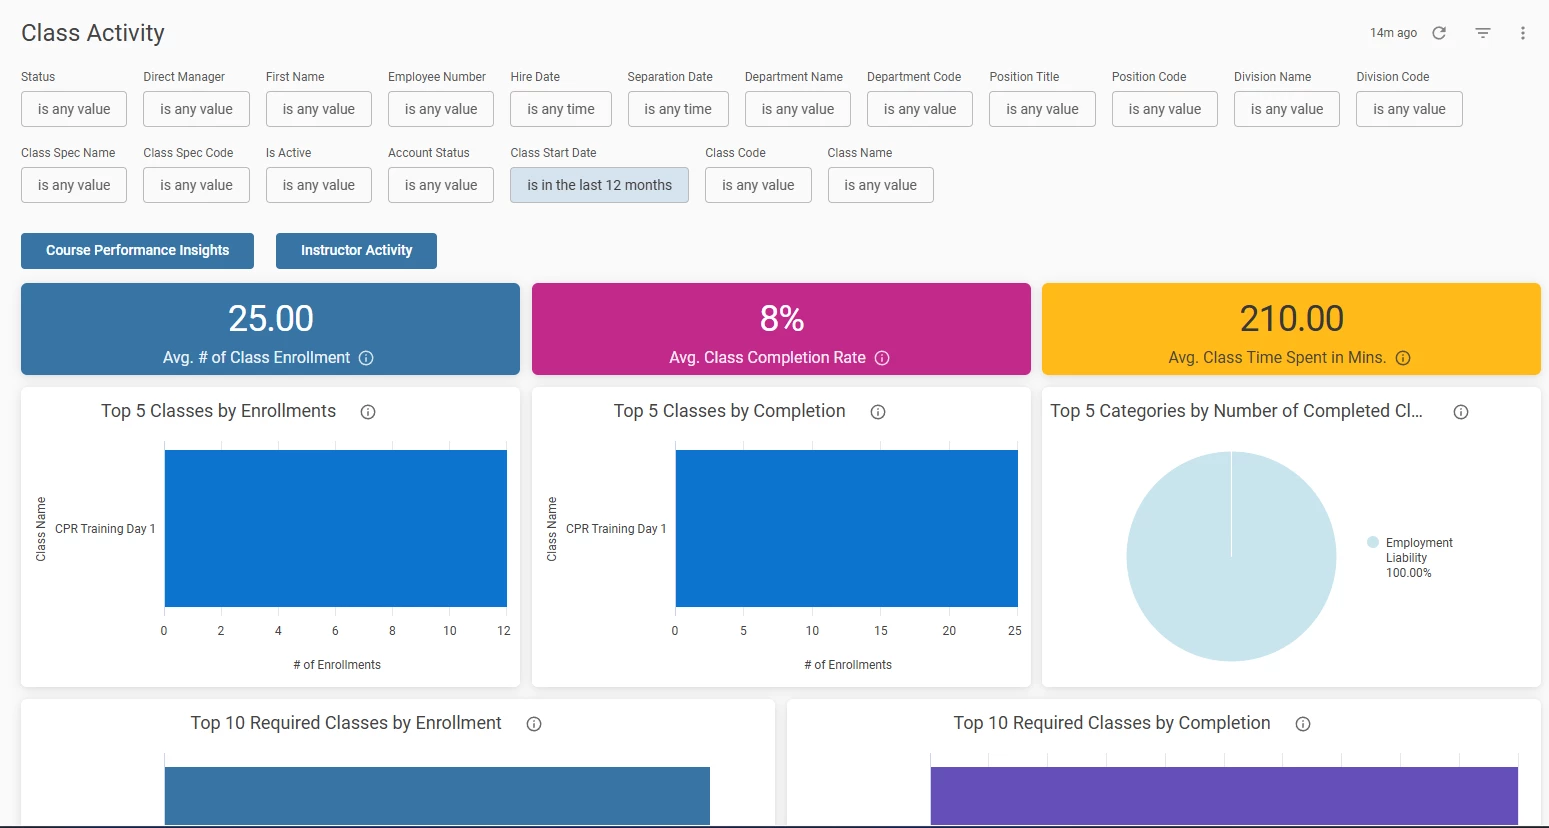
Class Activity Dashboard
We are excited to launch the Class Activity Dashboard, designed to provide administrators with a centralized view of Class (In-Person) training performance. This new Learn Analytics tool allows you to move beyond basic tracking to assess classroom utilization and in-person completion trends. By monitoring enrollment and attendance data, you can easily identify your most successful training sessions and determine where additional classroom resources or curriculum updates are required to support your learners.
Audience
Access to the Class Activity dashboard requires two conditions:
- The user must have access to the Learn product because the dashboard aggregates data from it.
- The user must have access to A&R.
Important Note: This dashboard is available to all agencies with access to the Course Performance Insights dashboard. If you do not have access but are interested, please contact your CSM. Additionally, user data is limited to internal agency staff and excludes external learners.
As visible in the picture below, the dashboard can be filtered using various criteria. We recommend refraining from utilizing any time value within date filters, as this may significantly increase the loading time.
Key Metrics & Value
The dashboard features several high-level tiles and detailed visualizations to help you measure success at a glance:
- Avg. # of Class Enrollment:
Understand the general reach of training programs. This helps an agency gauge whether your marketing efforts for new classes are driving the expected volume of learners.
- Avg. Class Completion Rate:
Directly measure learner commitment and course difficulty. A low completion rate may signal that a course is too challenging or that learners lack the necessary time to finish, allowing an agency to intervene early.
- Avg. Class Time Spent (Mins):
Quantify the total time investment required for training. This helps in workforce planning and ensures that the actual time spent aligns with the estimated duration of the curriculum.
- Top 5 Classes by Enrollment / Completion:
Quickly identify the agency's most popular and successful courses. This insight allows to replicate the format or content style of high-performing classes across other training modules.
- Top 5 Categories by Number of Completed Classes:
See which training domains are seeing the most activity, ensuring an agency stays compliant in critical regulatory areas.
- Top 10 Required Classes by Enrollment / Completion:
Specifically monitor "must-have" training. This ensures that mandatory certifications are tracking toward 100% compliance.
- Total Time Spent on Top 5 Completed Classes:
Identify which courses are consuming the most employee hours, providing a clear picture of the operational cost of specific training initiatives.
- Required Training Classes Status by Department:
Compare progress across different organizational units (e.g., Police Dept vs. HR). This allows you to hold specific department heads accountable for their team's training milestones.
Example
The Problem: An agency admin notices their Firearms Safety (ILT) course is always booked solid, yet the department's compliance rate is lagging.
The Solution: Using the Class Activity Dashboard, the admin identifies a 30% no-show rate for the morning sessions and a 20-person waitlist for the evenings.
The Result: The admin quickly shifts resources to add an evening session and implements a "last-call" reminder for morning slots. Result: Classroom throughput increases by 15% in one month without hiring more instructors.
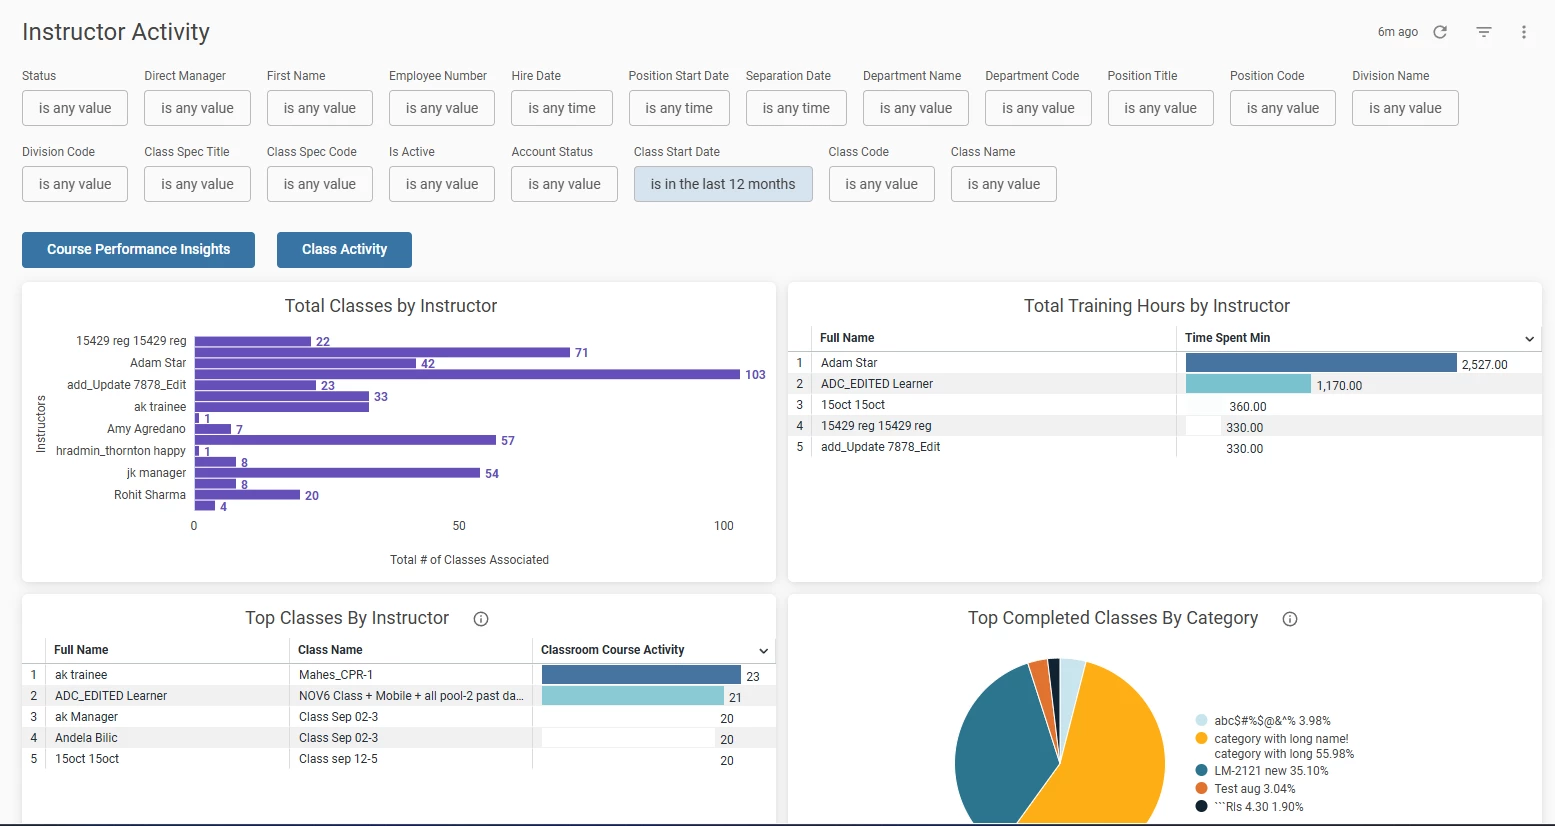
Instructor Activity Dashboard
Alongside the Class Activity Dashboard, we are launching the new Instructor Activity Dashboard, which is also part of the Learn dashboards. This tool helps administrators monitor instructor performance and workload across the agency, ensuring efficient use of teaching resources and effective delivery of training. The Instructor Activity Dashboard is designed to spotlight the educators behind your agency’s success. By consolidating data on class volume, instructional hours, and course popularity, administrators can monitor instructor output, recognize top performers, and ensure a balanced distribution of training responsibilities across the team.
Permissions required to view the Instructor Activity dashboard are identical to those for the Class Activity dashboard. Currently, instructor data is limited to internal agency staff and does not include external instructors.
Important Note: This dashboard is available to all agencies with access to the Course Performance Insights dashboard. If you do not have access but are interested, please contact your CSM.
To minimize loading time, we strongly advise against including any time values when applying date filters to the dashboard. The filtering options are visible in the image below.
Key Metrics & Value
The dashboard utilizes specialized visualizations to help you manage your instructional staff:
- Total Classes by Instructor:
Gain immediate visibility into the workload of the agency’s individual instructors. This helps administrators identify which team members are carrying the heaviest training loads and prevents burnout by allowing for data-driven redistribution of classes.
- Total Training Hours by Instructor:
Go beyond class counts to understand the actual time commitment of the staff. This metric is essential for payroll verification, performance reviews, and identifying which instructors are dedicated to long-form or intensive training sessions.
- Top Classes By Instructor:
Identify the most popular courses being led by the agency’s instructors. This allows admins to see which instructors are managing high-volume sessions and ensures that your most critical courses are assigned to your most active or experienced teachers.
- Top Completed Classes By Category:
Understand the subject matter expertise of the instructor pool. By seeing which categories have the highest completion rates, admins can determine if instructional talent aligns with the agency’s priority training areas.
Example
The Problem: A training director realizes that a handful of "go-to" instructors are burnt out from back-to-back sessions, while other qualified trainers are under-utilized. Meanwhile, it’s unclear which instructors are driving the highest learner satisfaction.
The Solution: Using the Instructor Activity Dashboard, the director compares instructional hours against course popularity. They find that Instructor "A" is teaching 40% of all agency hours, while Instructor "B" has the highest student engagement scores but only teaches once a month.
The Result: The director rebalances the calendar to prevent burnout and assigns Instructor "B" to lead a "Train the Trainer" session. Result: A 20% more balanced workload and a measurable boost in overall agency training quality.
