


Article Links
Timeline
When will this be released?
January 15th 2026, 3 PM PST
Is there downtime for this release?
No
NEOGOV Analytics Dashboards
We are excited to present the latest suite of NEOGOV's Dashboards - Learn and eForms dashboards. Designed with user-centric upgrades, these new tools provide HR professionals, managers, and department heads with a streamlined experience that enhances productivity and decision-making.
Each dashboard offers a unique set of features tailored to optimize your workflow:
- Learn Dashboard - offers real-time insights and centralized metrics to enhance learning outcomes, track compliance, and facilitate data-driven decisions.
- eForms Dashboard - simplifies the process of managing electronic forms with real-time task status tracking, facilitating seamless workflow approval processes.
These dashboards are currently accessible to select agencies, with a planned expansion to all users in Q1 2026. Please refer to the attached release notes (Analytics & Reporting Release Notes, December 2025) for more details.
Learn Dashboard
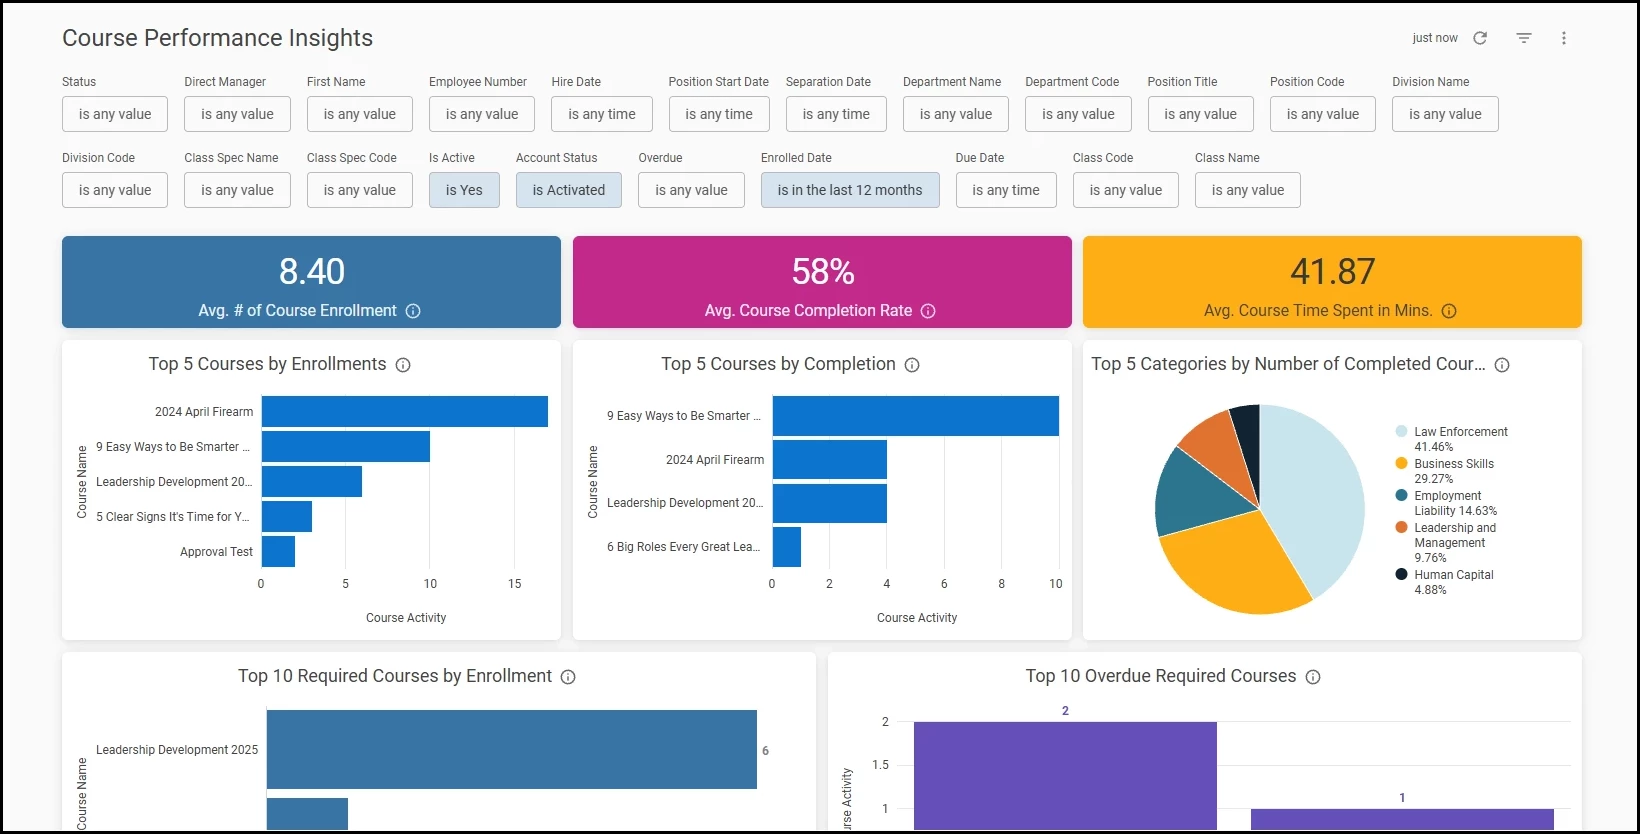
The Course Performance Insights dashboard for Learn is a comprehensive analytics solution designed to provide actionable insights into your organization's training and development programs. This dashboard empowers users with real-time visibility into course activity, learner engagement, and compliance tracking across your organization.
This dashboard centralizes key training metrics in an intuitive, interactive interface, enabling data-driven decision-making to optimize learning outcomes and ensure regulatory compliance. With robust filtering capabilities and department-level access controls, users can quickly identify trends, monitor training progress, and address compliance gaps.
Access to the Learn dashboard requires two conditions:
- The user must have access to the Learn product because the dashboard aggregates data from it.
- The user must have access to A&R.
As visible in the picture below, the dashboard can be filtered using various criteria. We recommend refraining from utilizing any time value within date filters, as this may significantly increase the loading time.
Key Dashboard Features
- Average Number of Course Enrollments
Displays the average enrollment count across all courses within the selected timeframe. This metric helps users understand overall course demand and capacity planning needs, enabling better resource allocation and course scheduling decisions.
Customer value: The average enrollment count offers insight into course demand and aids capacity planning. This metric helps organizations allocate resources efficiently and optimize scheduling, improving both the learning experience and operational efficiency.
- Average Course Completion Rate
Calculates the percentage of enrolled learners who complete courses. This critical metric provides insight into learner engagement and course effectiveness, helping identify courses that may require additional support, clearer instructions, or content improvements to boost completion rates.
Customer value: Tracking course completion rates reveals learner engagement and content effectiveness. This insight is crucial for identifying areas needing support or improvement, ensuring learner success and desired course outcomes.
- Average Course Time Spent in Minutes
Tracks the average time learners invest in completing course content. This metric supports workload planning, course design optimization, and helps validate whether course duration estimates align with actual learner experience.
Customer value: Tracking the average time spent on course material helps optimize workload planning and course design, ensuring course lengths meet expectations and improving training effectiveness and usability.
- Top 5 Courses by Enrollments
Identifies the most popular courses based on enrollment numbers. This metric reveals which training topics are in highest demand across your organization, informing decisions about course capacity, instructor allocation, and future curriculum development.
Customer value: Identifying the most popular courses based on enrollments provides insights into training trends and preferences, enabling organizations to allocate resources such as instructors and facilities more effectively, and to guide future curriculum development toward areas of highest demand.
- Top 5 Courses by Completion
Highlights courses with the highest number of successful completions. Understanding which courses learners complete most frequently helps identify effective training content and best practices that can be replicated across other programs.
Customer value: Recognizing courses with the highest completion rates helps organizations identify successful training strategies and effective content. These insights can be leveraged to replicate best practices across other programs, thereby enhancing overall training effectiveness.
- Top 5 Categories by Number of Completed Courses
Visualizes training activity across different course categories (e.g., compliance, professional development, technical skills). This metric enables strategic oversight of training portfolio balance and helps ensure alignment with organizational priorities.
Customer value: Training activity insight by category provides strategic oversight of the organization's training portfolio, ensuring alignment with priorities and addressing employee skill and development needs.
- Required Training Status by Department
Displays the distribution of required course statuses (Completed, Enrolled, In Progress) across the top 10 departments by completion count. This department-level view enables managers to monitor compliance requirements, identify departments that may need additional support, and ensure equitable training distribution across the organization.
Customer value: Monitoring department training statuses ensures compliance, supports equitable learning, identifies support needs, and maintains organizational performance.
- Top 10 Required Courses by Enrollment
Shows which mandatory courses have the highest enrollment numbers. This metric is essential for compliance tracking and helps ensure critical training requirements are being met across the organization.
Customer value: High enrollment in required courses indicates a focus on meeting compliance and training targets. This metric is essential for ensuring that critical knowledge and skills are imparted efficiently across the organization, minimizing potential compliance risks.
- Top 10 Required Courses by Completion
Identifies required courses with the highest completion rates. Monitoring mandatory training completion is critical for regulatory compliance, risk management, and ensuring organizational readiness.
Customer value: Measuring completion rates of required courses ensures that compliance requirements are met. This strengthens the organization’s readiness to meet regulatory and operational standards, and reduces exposure to potential risks associated with non-compliance.
- Top 10 Overdue Required Courses
Highlights required courses with the highest number of overdue enrollments. This critical compliance metric enables proactive intervention, helping managers identify at-risk learners and prevent compliance violations before they become organizational liabilities.
Customer value: Identifying overdue courses provides the opportunity for timely intervention to support at-risk learners. This proactive approach helps prevent compliance violations and fosters a compliant, well-prepared workforce.
- Total Time Spent on Top 5 Completed Courses
Aggregates total learner time investment across the most completed courses. This metric supports return-on-investment analysis and helps quantify the organizational commitment to professional development.
Customer value: Evaluating total time investment in top courses enables return-on-investment analysis for training initiatives. This understanding helps quantify the organizational commitment to professional development and supports future training strategy optimization.
Value and Benefits
The Course Performance Insights Dashboard transforms how your organization manages learning and development by providing:
- Enhanced compliance management
Real-time visibility into required training status and overdue courses enables proactive compliance monitoring, reducing organizational risk and ensuring regulatory requirements are consistently met across all departments.
- Data-driven decision making
Comprehensive enrollment, completion, and time-spent metrics empower administrators to make informed decisions about course offerings, resource allocation, and curriculum development based on actual learner behavior and engagement patterns.
- Improved operational efficiency
Interactive filters and department-level views eliminate manual reporting processes, enabling managers to quickly access the specific information they need without submitting data requests or waiting for custom reports.
- Strategic workforce development
Trending data on popular courses and completion patterns reveals skill development priorities across your organization, supporting strategic workforce planning and talent development initiatives.
- Accountability and transparency
Department-level performance metrics create clear accountability for training completion while providing managers with the insights needed to support their teams effectively.
- Time savings
Consolidating multiple training metrics in a single, filterable dashboard reduces time spent gathering and analyzing training data, allowing administrators and managers to focus on strategic initiatives rather than manual reporting.
eForms Dashboard
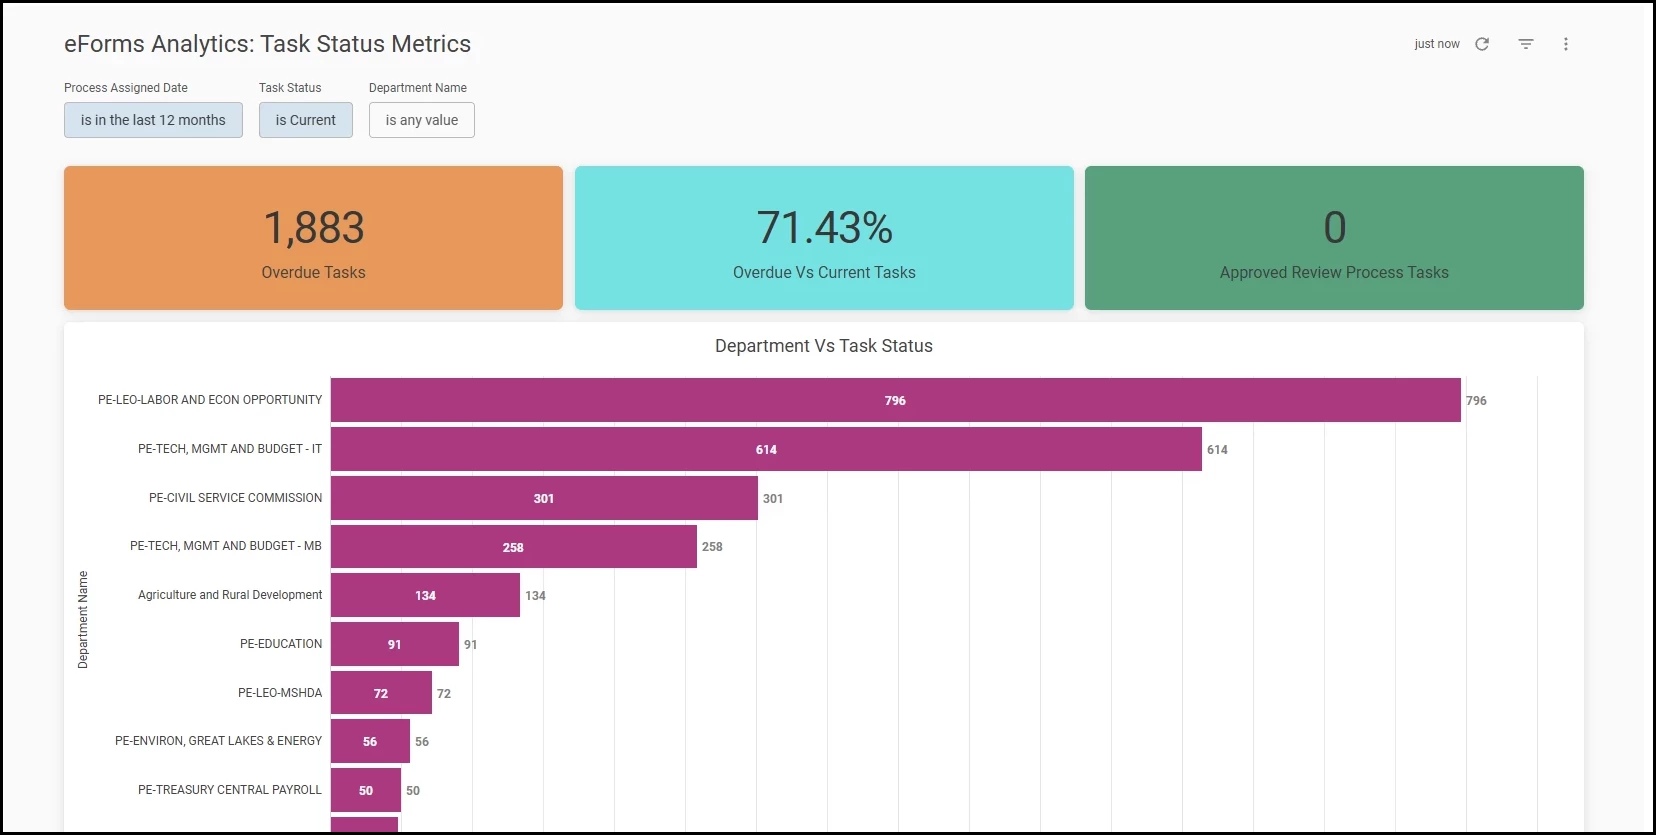
The eForms Dashboard is designed to provide eForms users with actionable insights into their task management processes, enabling data-driven decisions and improved operational efficiency. With a user-friendly interface and advanced filtering options, the dashboard empowers departments to monitor, analyze, and optimize their workflows.
Access to the eForms dashboard requires two conditions:
- The user must have access to the eForms product because the dashboard aggregates data from it.
- The user must have access to A&R.
Key Dashboard Features
- Overdue Tasks
This single-value metric highlights the total number of overdue tasks. It enables users to promptly address outstanding items, reducing delays and ensuring timely completion of critical processes.
Customer value: provides immediate visibility into overdue tasks, allowing users to take prompt action to resolve delays and maintain process efficiency.
- Overdue Vs Current Task
This metric compares the number of overdue tasks to those currently in progress. It provides a clear snapshot of task health, helping users prioritize urgent actions and maintain balanced workloads.
Customer value: offers a clear comparison between overdue and current tasks, helping users prioritize urgent items and balance workloads for improved productivity.
- Approved Review Process Tasks
This single-value metric displays the count of review process tasks that have been approved. It offers a quick overview of successful task completions, supporting recognition and process optimization.
Customer value: highlights the number of successfully approved review tasks, supporting recognition of achievements and helping teams track progress toward goals.
- Department Vs Task Status
This interactive bar chart visualizes the distribution of task statuses across departments. By displaying counts of tasks by status (e.g., current, overdue, denied, approved), users can quickly identify bottlenecks, track departmental performance, and allocate resources more effectively.
Customer value: enables users to monitor task distribution and status across departments, helping identify areas with high workloads or bottlenecks. This insight supports better resource allocation and process optimization.
- Denied Tasks with Comments
This detailed grid lists tasks that have been denied, including reviewer comments and relevant employee information. It supports transparency and continuous improvement by allowing users to review feedback, understand reasons for denial, and refine future submissions.
Customer value: delivers transparency by showing denied tasks along with reviewer comments, enabling users to understand reasons for denial and improve future submissions.
Value and Benefits
- Enhanced visibility
Users gain a comprehensive view of task statuses across departments, enabling proactive management and early identification of issues. - Improved accountability
Detailed metrics and comments foster transparency, helping teams understand performance and areas for improvement. - Streamlined processes
By highlighting overdue and denied tasks, the dashboard supports timely interventions and process refinement. - Customizable insights
Advanced filters (Process Assigned Date, Task Status, Department Name) allow users to tailor views to their specific needs, ensuring relevant and actionable information. - Empowered decision-making
Real-time data enables users to make informed decisions, optimize resource allocation, and drive continuous improvement.
Recruitment Reports Enhancement
We are pleased to announce an enhancement to the recruitment reports. This update offers more profound visibility into your candidate data management through the introduction of new reporting capabilities for application retention settings.
Retain Applications Permanently field
Users can now access the Retain Applications Permanently field within the Master Profile section of Report Builder. This field is available for both Live and Historical source recruitment reports.
A user can incorporate this field as a:
- Column in the report
- Use it to generate charts
- Include it in logic for calculated fields
Users can also filter reports using this field. They can set the values as needed to isolate specific record sets for analysis.

Value
This enhancement aids HR administrators in managing data retention and compliance. Reporting on applications marked for permanent retention allows organizations to audit databases and protect high-value candidate profiles from automated purging.
Audience
This feature is available to all Insight users who have access to the Report Builder.
Example
- Maria, an HR admin, needs to audit the database for candidates marked for permanent retention. She will create a recruitment report and use a filter, Retain Applications Permanently, set to true.
Payroll Reports Enhancement
NEOGOV has enhanced the data structure and filtering options within the Pay History and Pay Transaction modules. This update improves the granularity and flexibility of pay line details and transaction management for users working with financial data in the system.
Pay History- Pay Line Details and Pay Transactions Reports
We have introduced several key updates to the Pay Line Details and Pay Transaction reports to streamline your auditing and cost-allocation processes:
- Pay History - Pay Line Details Report
- We've introduced a new field, Equipment Code, now accessible in the Pay Lines section.
- Additionally, users can now instantly isolate specific datasets using new filter options for both Equipment Code and Work Order.
- Pay Transaction Report
- We've enhanced this report with filter options for Work Order and Equipment Code, promoting uniformity in your financial reporting.
Value
These updates offer payroll users improved data clarity and management capabilities, enhancing operational efficiency and strategic decision-making through refined data filtering.
Audience
Available for Payroll users with access to Report Builder
Example
- Maria, a payroll admin, can now filter pay history reports to focus solely on entries related to specific equipment codes or work orders, saving time and improving report accuracy.
- Jack, a payroll admin, can conduct more precise cost analysis by filtering pay transactions associated with particular work orders or equipment codes, aligning financial reviews with operational needs.
Bugs Resolved
Functional
| Scenario When Issue Encountered | Issue Resolved |
| The system prevented users from adding the S.S.N. field from the Who’s Covered section to the Enrollments report and displayed an error message. | A user is able to add the S.S.N field to the Enrollments report. |