
Timeline
When will this be released?
February 18th 2026, 3 PM PST
Is there downtime for this release?
No
Related Release Note Links
- Analytics and Reporting Release Notes December 2025
- Analytics and Reporting Release Notes February 2026 - part I
NEOGOV Analytics Dashboards
Perform Dashboard
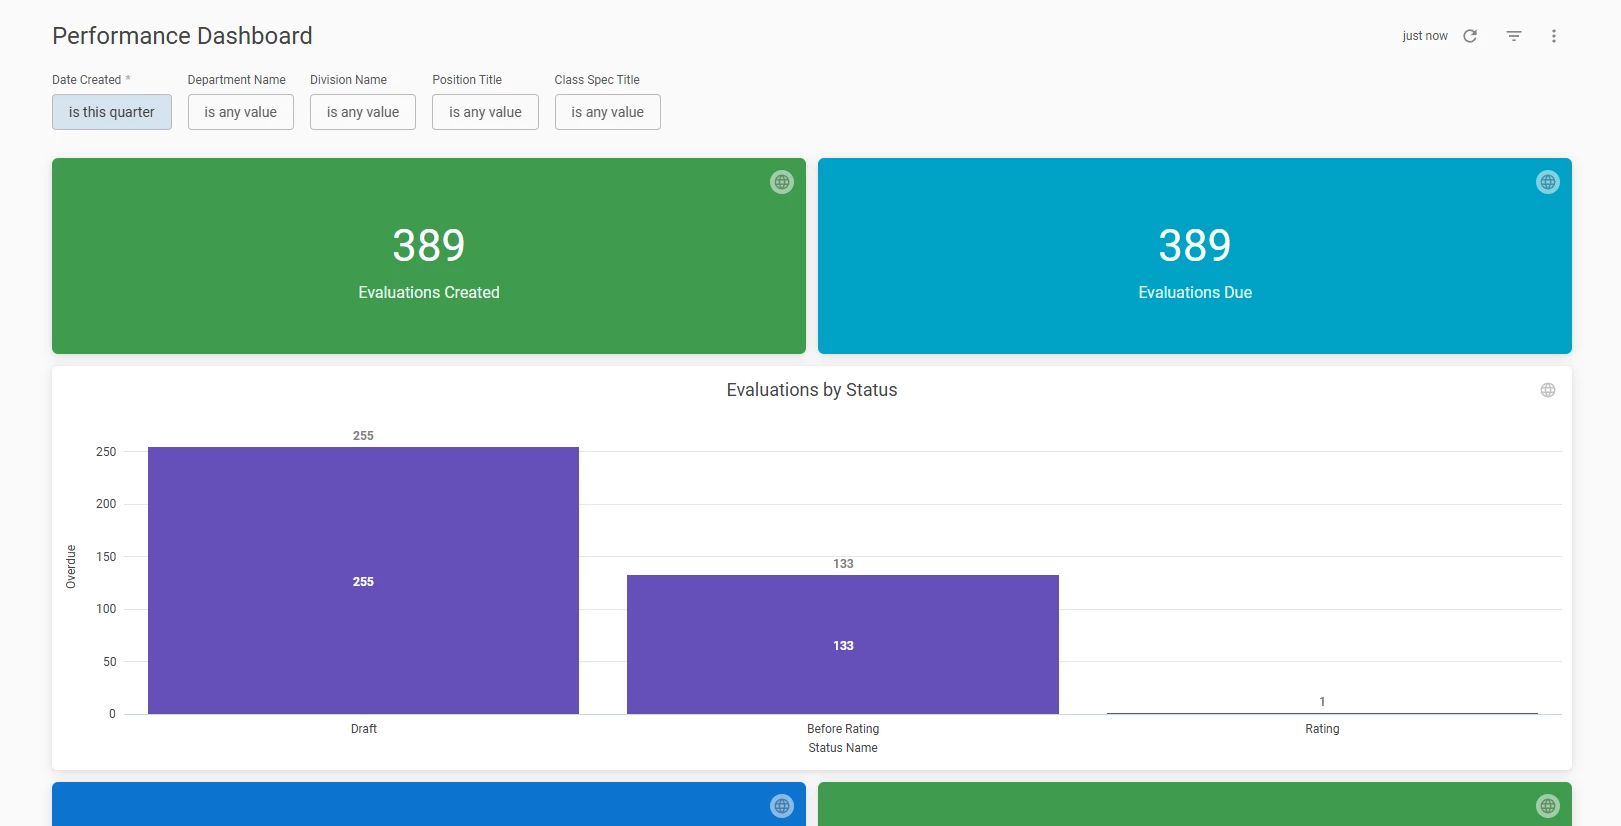
We are proud to introduce the new Performance Dashboard, a robust analytics solution designed for HR leaders, department heads, and supervisors. This dashboard provides a view of your organization's talent management health by merging two critical pillars of employee development: formal performance evaluations and continuous journaling.
By surfacing real-time data on evaluation compliance and the frequency of feedback through journals, the Performance Dashboard enables leadership to foster a culture of accountability and ongoing professional growth.
Access to the Perform dashboard requires two conditions:
- The user must have access to the Perform product because the dashboard aggregates data from it.
- The user must have access to A&R.
Analytics > Perform Dashboard
Note: This dashboard is currently available to select agencies, with a rollout to all users planned for Q1 2026. For additional information on this and other features of the dashboard, please see the attached release notes: Analytics & Reporting Release Notes, December 2025.
Key Metrics
The dashboard is structured to provide both high-level summaries and trend-based insights into your performance management processes.
- Evaluations Created
This metric tracks the total volume of performance evaluations generated within the selected timeframe. It utilizes conditional formatting to highlight activity, turning green when evaluations are being actively created and red if the count sits at zero.
Customer Value: this tile serves as an initiative tracker, enabling HR to verify that the expected number of evaluations were successfully triggered organization-wide during a new review cycle launch. This confirms the automated kickoff process was comprehensive.
- Evaluations Due
This single-value tile displays the aggregate count of evaluations currently in progress, excluding those with a status of "Completed" or "Cancelled".
Customer Value: This is the "Outstanding Work" indicator, which offers an immediate assessment of the remaining administrative workload for managers. By monitoring this metric, HR can proactively determine if the organization is positioned to achieve its end-of-quarter objectives or if supplementary communication is required to expedite the completion of pending reviews.
- Evaluations by Status
A comprehensive bar chart that categorizes evaluations as "On-Time" or "Overdue". An evaluation is "On-Time" if it is upcoming or completed by the due date and it is marked "Overdue" if the due date has passed without completion.
Customer Value: As your main compliance tool, this feature is essential for quickly pinpointing departments or teams that are lagging in their review cycles, thus guaranteeing that all employees receive a performance discussion on time.
- Journals Created & Shared
Separate tiles have been implemented to monitor the aggregate volume of journal entries created and, specifically, the quantity of those shared with external stakeholders.
Customer Value: Sustained feedback serves as the cornerstone of contemporary performance management. These metrics facilitate the measurement of journaling adoption as a mechanism for capturing spontaneous feedback outside of the official annual review process.
- Top 10 Journal Targets
A pie chart highlighting the individuals who are receiving the highest volume of published journal entries.
Customer Value: This feature assists in identifying employees who are frequently coached or who receive significant recognition. Conversely, it can highlight employees who may have insufficient documented feedback and require increased supervisory engagement.
- Journal Creation by Month
This line chart visualizes the total count of journal entries created, plotted chronologically by month.
Customer Value: This metric moves beyond "point-in-time" data to show long-term engagement trends. Monitoring journal creation "peaks and valleys" helps identify if managers are documenting feedback only during formal reviews or adopting a year-round coaching habit. This data encourages consistent, real-time documentation, leading to fairer and more accurate performance summaries.
- Journal Entries: YOY Monthly Trend
A line chart comparing journal creation trends month-over-month for the current year versus last year.
Customer Value: This feature allows for the longitudinal monitoring of organization's feedback culture. By tracking whether engagement increases during specific initiatives or decreases during high-demand periods, HR can develop targeted internal communication strategies to ensure consistent feedback contribution.
Values & Benefits
The Performance Dashboard transforms administrative tasks into strategic insights for your everyday HR processes:
- Eliminate compliance gaps
With the automated "Evaluation Label" logic, organizations no longer need to manually calculate which reviews are late. The data is processed instantly, allowing to move straight to resolution.
- Promote a feedback culture
By monitoring journal creation trends, organizations can encourage supervisors to document performance throughout the year, leading to more accurate and fair year-end evaluations.
- Granular filtering for leadership
Whether you are a Division Manager or a Department Head, you can use the Department Name, Division Name, and Position Title filters to view data relevant to your specific span of control.
- Predictable talent management
Monthly and yearly trends help you forecast when your organization hits its peak "performance season," allowing you to better support staff during high-pressure periods.
eForms Dashboard Enhancement
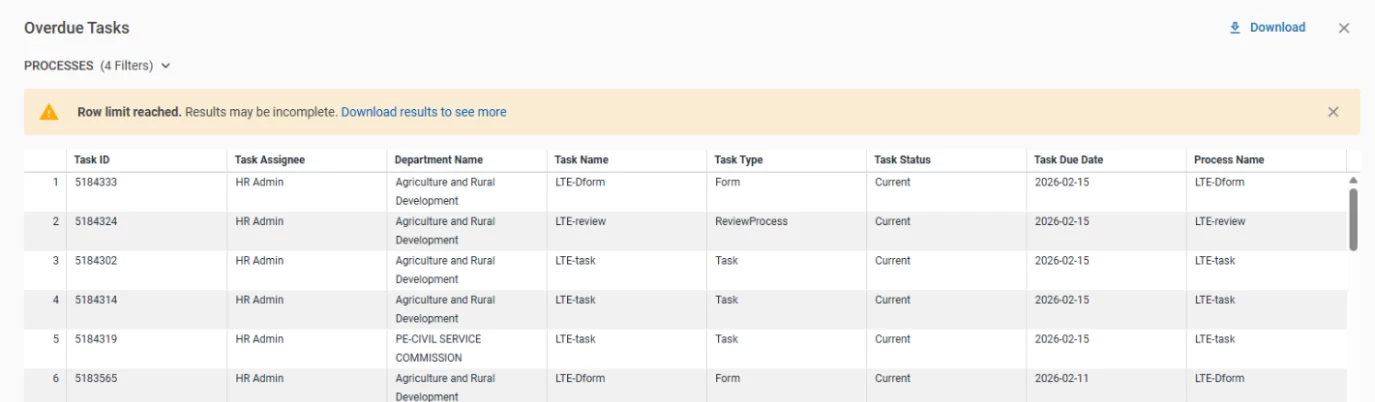
Based on customer feedback, the eForms dashboard has been enhanced to allow users to drill down into the Overdue Task tile. This provides quick access to detailed task information, significantly improving task management and oversight.
Overdue Tasks Drill-Down Details
The drill-down option for the Overdue Task tile includes several critical fields, allowing users to view and analyze tasks in greater detail:
- Task Name: The specific title or name of the task.
- Task Type: The category or nature of the task.
- Task Status: The current progress or completion state of the task.
- Task Due Date: The target date for timely completion.
- Task Assignee: The individual responsible for carrying out the task.
- Department Name: The department associated with the process assignee.
- Process Name: The name of the process to which the task belongs.
Analytics > eForms Dashboards> Drill down on Overdue Tasks tile
Value
This enhancement improves task management efficiency and visibility for EF users by offering comprehensive task details. Users can now quickly determine task ownership, track progress, and view deadlines, leading to faster task completion and better coordination across departments.
Audience
eForms user with access to A&R.
Enhanced Public Report Management for HR Admins
Building on the four product reports introduced in January and the beginning of February, NEOGOV has now launched new capabilities for users to manage public reports specifically for cross-product report - Applicants with Offers and Hires with Onboard Prehires/Employees, Checklists and Tasks. This enhancement gives users complete control over public report management, equipping them with the information they need to stay current and effectively support their employees.
Note: Public Report management capability was previously only available for recruitment reports. We plan to extend this option to all HCM products by the end of the quarter. Currently, it is available for Insight, Onboard, Perform, Learn and eForms reports.
Public Report Management Permissions
Since the cross-product report - Applicants with Offers and Hires with Onboard Prehires/Employees, Checklists and Tasks pulls data from Insight and Onboard, to gain the ability to edit public reports, users must be assigned either:
- HR Admin role in Onboard
- The New RB Administrator been set to ON
Note: Users must have at least one of the mentioned permissions to manage public, cross-product reports. Removing both permissions will revoke the user's ability to manage these reports.
Report and Subscription Management
Users with permissions mentioned above now have comprehensive control over public reports and their distribution:
- Public report actions: easily view, edit, and delete existing public reports to ensure they meet your organization's needs.
- Subscription management: take control of how and when report updates are shared. HR Admins can now create, view, edit, and delete subscriptions for public reports, providing greater flexibility in distribution and access configuration.
Value
These enhancements increase transparency and efficiency in report management for users, empowering them to better support their teams with real-time access to necessary data and report insights.
Audience
Users with the HR Admin role in Onboard and/or New RB Administrator permission in Insight.
Example
- Maria, an HR User, created the cross-product public report. Jake, an HR Admin in Onboard, was able to edit this report and update the subscription originally set by Maria due to his permissions.
- Even after Maria, an HR User, was terminated, Jake, an HR Admin in Onboard, could locate and successfully remove the subscriptions associated with Maria's public reports.
- John is an employee who has an HR Admin role in Onboard, but doesn’t have New RB Administrator permission in Insight. When he goes to RB, he is able to manage public cross-product reports.
- Susana is an employee who has only the New RB Administrator permission in Insight, but doesn’t have the HR Admin role in Onboard. When she goes to RB, she is able to manage public cross-product reports.
Announcement
With this release, the Provide Feedback button has been removed from the Top Navigation Bar. This means the option to submit feedback via the Google Form is no longer available.

For any future requests, please reach out to your CSM for assistance.