

Timeline
When will this be released?
The dashboards are currently available in production for select agencies.
NEOGOV Analytics Dashboards
We are excited to introduce the latest enhancements to NEOGOV’s Analytics Dashboards, designed to provide deeper insights, improved visibility, and more actionable intelligence across your recruitment and HR operations. These dashboards empower HR leaders, recruiters, and department managers with clear, data-driven perspectives to support strategic decision‑making.
This release includes updates to two key dashboards:
- Attract Dashboard – focused on applicant sourcing, hiring funnel analytics, and recruiting efficiency.
- HR Director Dashboard – designed for high‑level workforce insights, requisition monitoring, and applicant demographics.
These dashboards are currently accessible to select agencies, with a planned expansion to all users in Q1 2026. Please refer to the last paragraph for more details.
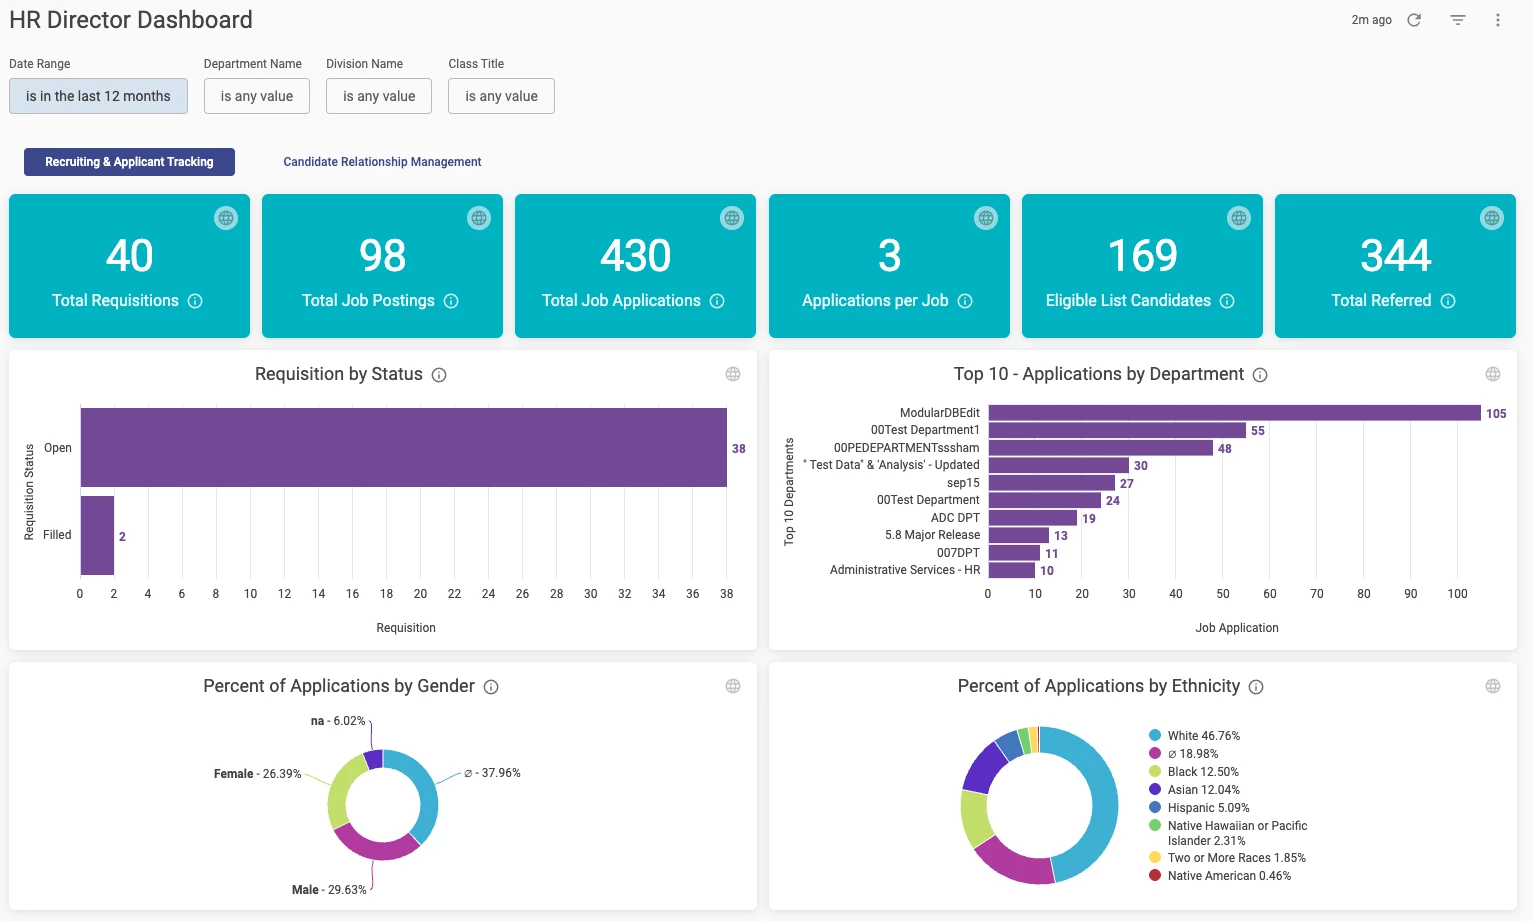
HR Director Dashboard
The HR Director Dashboard provides holistic visibility into your organization’s hiring operations, enabling leadership to quickly spot trends, bottlenecks, and workforce representation insights.
Access to the HR Director dashboard requires two conditions:
- The customer must have the Insight product because the dashboard aggregates data from it.
- The user must be assigned the HR Admin role.
If these conditions are met, the user should navigate to Analytics and select the HR Director tab from the left menu on the landing page.
Analytics > HR Director
Key Dashboard Components and Benefits
- High-Level Requisition & Applicant KPIs
Tiles include:
- Total Requisitions
- Total Job Postings
- Total Job Applications
- Applications per Job
- Eligible List Candidates
- Total Referred
Customer Value: Leadership gains a snapshot understanding of hiring activity, pipeline health, and referral outcomes.
- Requisition Status Breakdown
A bar chart visualizes open vs. filled requisitions.
Customer Value: Quickly identifies workload distribution and departments that may require additional support.
- Top 10 Departments by Application Volume
A horizontal bar chart lists the departments receiving the most applications.
Customer Value: Helps HR understand recruitment demand and applicant interest trends across the organization.
- Applicant Demographics
Two donut charts show breakdowns by:
- Gender
- Ethnicity
Customer Value: Supports diversity, equity, and inclusion (DEI) initiatives by providing real-time insight into applicant pool demographics.
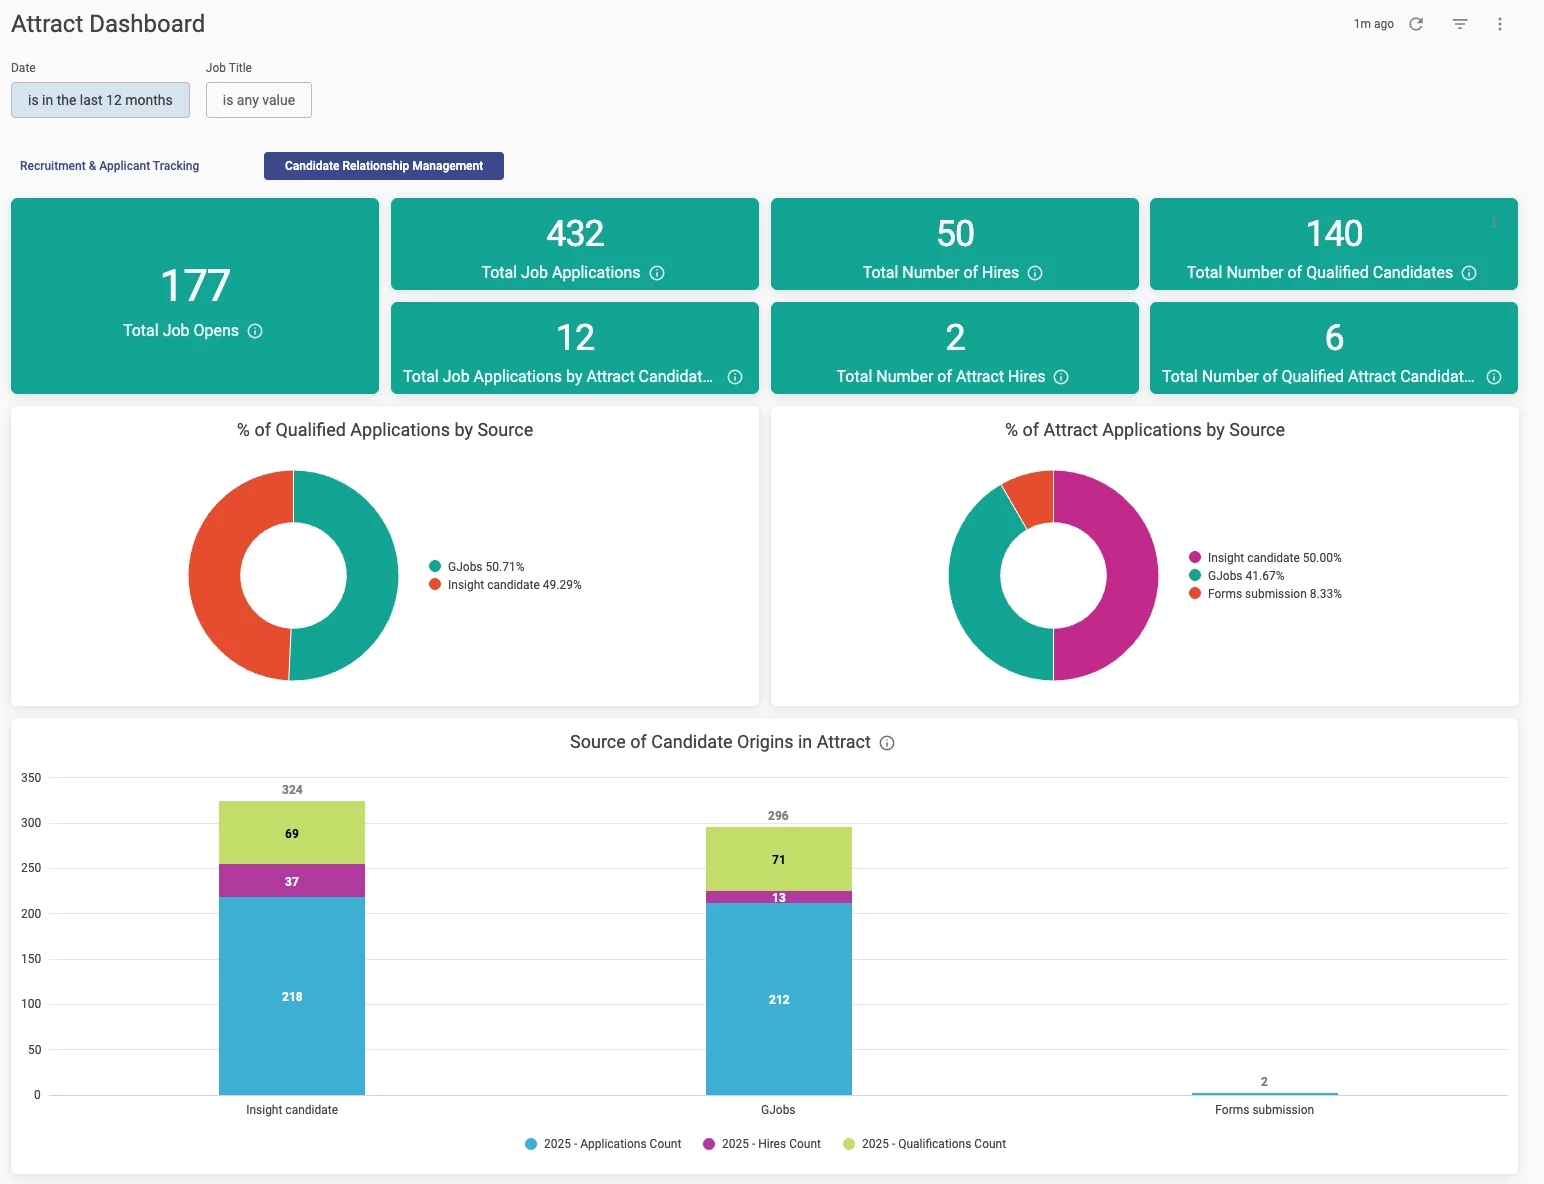
Attract Dashboard
The Attract Dashboard provides a comprehensive look at your recruitment performance, from job openings to candidate quality and hiring sources. It is built to help recruiting teams understand where candidates originate, how they move through the process, and where improvements may be needed.
Analytics > HR Director > Candidate Relationship Management
Key Dashboard Components and Benefits
- Recruitment Metrics Overview
Tiles across the top of the dashboard summarize:
- Total Job Opens
- Total Job Applications
- Total Number of Hires
- Total Qualified Candidates
Application and Hire Counts tied to Attract-Specific Campaigns
Customer Value: Immediate visibility into recruitment volume and hiring outcomes helps teams assess productivity and identify whether additional sourcing or advertising is needed.
- Qualified Applications by Source
A dounat chart highlights the distribution of qualified applicants by source (e.g., Insight, GovernmentJobs postings).
Customer Value: Shows which platforms bring in the highest-quality talent, enabling better allocation of advertising spend.
- Applications by Source
A companion donut chart displays the total number of applications by source, not just qualified ones.
Customer Value: Helps compare application volume vs. qualified applicant rate—crucial for evaluating source effectiveness.
- Candidate Origins by Year
A stacked bar chart visualizes:
- Application volume
- Number of hires
- Number of qualified candidates
These factors are gathered across major applicant sources (Insight Candidate, GovernmentJobs, Forms Submissions).
Customer Value: Enables year-over-year or source-over-source comparison of funnel progression and hire quality.
Additional dashboard options
Users can utilise various options within the dashboard to leverage the comprehensive data overview it provides:
- Access detailed data by drilling down into tiles.
- Deliver data via scheduled email deliveries.
- Export data from the dashboard or individual tile level.
As an example, we will use the HR Director dashboard to explain additional options on the dashboard.
Access to detailed data
A user can access detailed data by drilling down into tiles. We would like to note that some tiles don’t have this option.
On the HR Director dashboard, the Top 10 - Applications by Department tile offers drill-down functionality. Clicking on a specific department's bar in the chart will open a new window, displaying a detailed table view of the applications for that department.
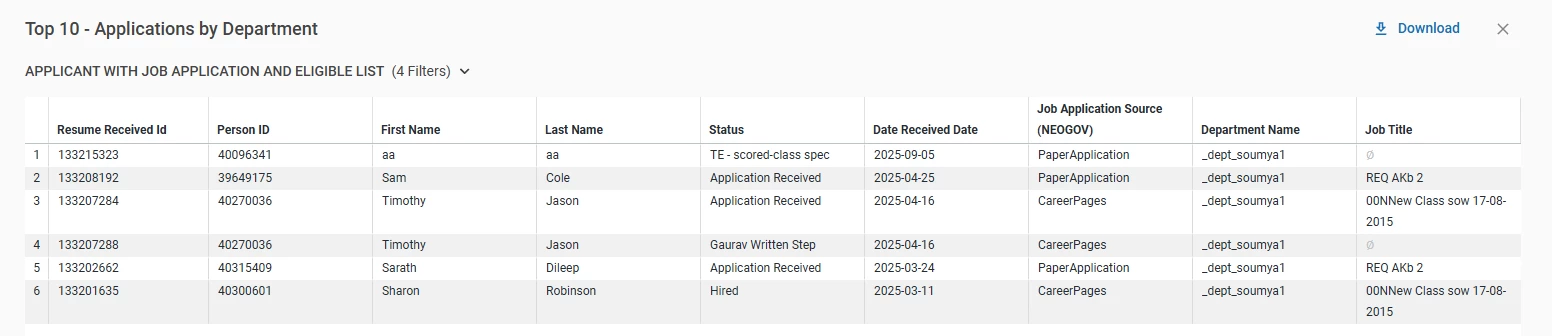
Analytics > HR Director > Top 10 - Applications by Department > Drill down on the specific bar
This detailed view provides quick access to application-related information for a specific department directly within the dashboard. Users can easily find detailed information without needing to navigate to a different product or run a separate report.
The drill-down option is also available in most other tiles. Some tiles, however, contain simple data that does not require drilling down, so the option is not present.
Scheduled deliveries
To share a dashboard with other users, click the three dots in the upper right corner of the dashboard and select the Schedule delivery option.
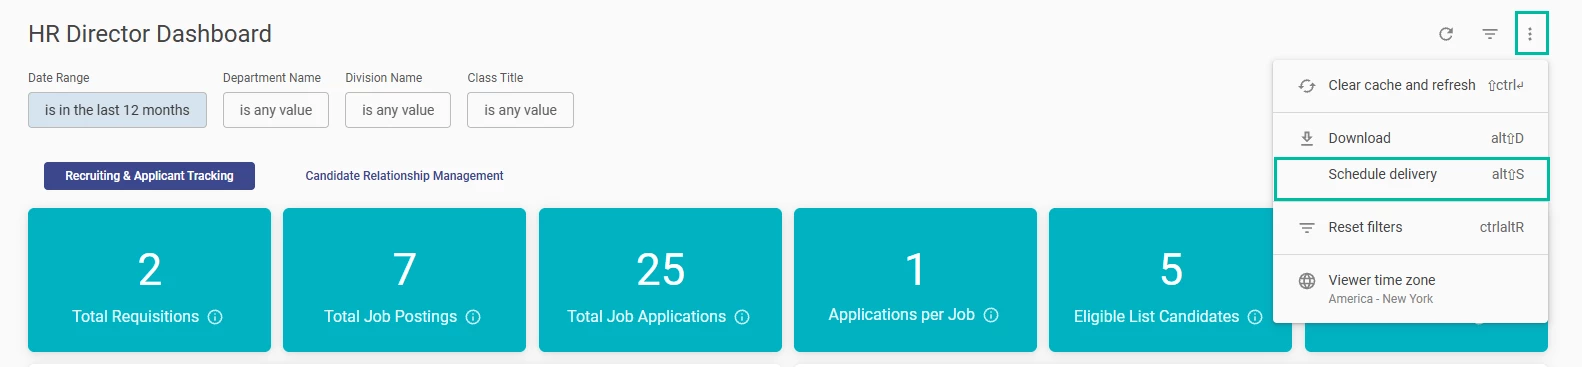
HR Director > Schedule delivery
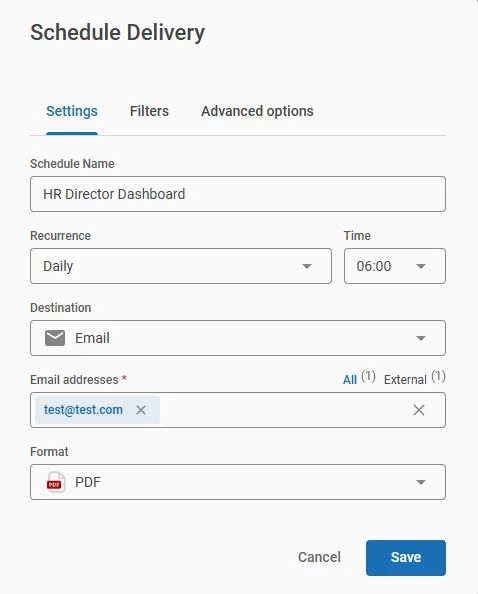
After a user selects this option, a new pop-up window will appear with the information that needs to be filled out.
Under the Recurrence, a user can choose between different options:
- Daily (default option)
- Monthly
- Weekly
- Hourly
- Minutes
- Specific months
- Specific days
- Send now
If a recurrence is selected (excluding "send now"), the user must define the time. The default time is set to 6:00 AM.
HR Director > Schedule delivery
An HR Admin can send a dashboard to any user, even if they do not have direct access to it, by simply entering their email address. Once the delivery is saved, the recipient will receive an email with the dashboard attached in the chosen format.
The default format is PDF, but a user can select from the following options:
- CSV zip file
- PNG visualization
To send the delivery, a user needs to click on the Save button.
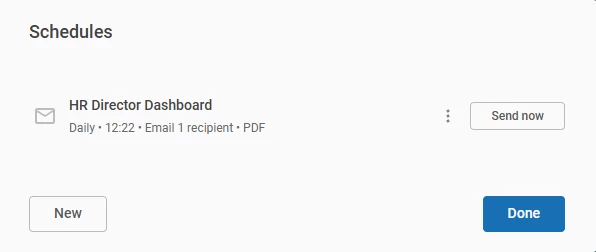
Once a delivery is scheduled, you can review it by clicking the Schedule delivery button. A pop-up window will display the currently scheduled deliveries. Scheduled deliveries are private to the user who created them. Other users cannot view or edit them.
HR Director > Schedule Delivery
If a user wants to schedule a new delivery, click the New button.
To delete or edit an existing delivery, click the three dots next to the delivery name and choose the desired action.
Export data
Data export functionality is accessible at two levels:
- Dashboard
- Tile
To export data for an entire dashboard, click the three dots in the upper-right corner and select Download.

HR Director > Download
When downloading a report, a new pop-up window will prompt you to select the desired format. The available download formats are:
- PDF (default)
- CSV
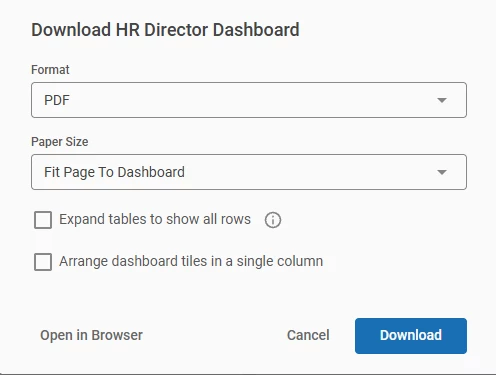
The user must click the Download button to complete the action.
Data export on the tile level is available for:
- the whole tile
- drill down data
To download the complete data for a tile, click the three-dot menu and select the Download option.
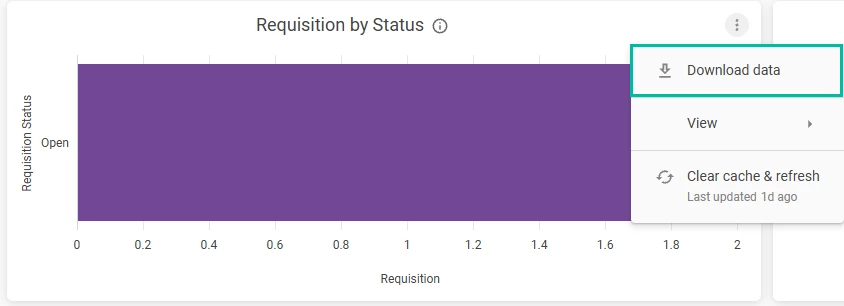
HR Director > Requisition by Status tile > Download
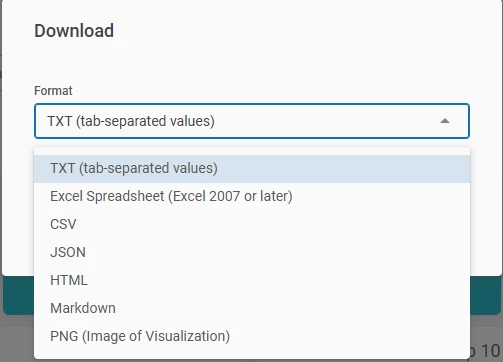
After selecting the Download option, a pop-up window will appear. Choose your desired format from the available options (visible in the picture below), and then click the Download button to complete the action.
To export data from a drill-down view, first perform the drill-down action, and then follow the same export procedure used for the tile itself.
Benefits of the Updated Dashboards
These analytics enhancements deliver substantial value to NEOGOV customers:
- Stronger Decision-Making
Clear visualizations help HR staff and leadership quickly identify trends, bottlenecks, and opportunities.
- Improved Recruiting ROI
By understanding which sources yield the best candidates, organizations can optimize recruitment spending.
- Enhanced Transparency & Accountability
Leaders can monitor progress toward hiring goals and staffing needs across departments.
- Support for DEI Initiatives
Demographic insights provide essential data for fair and inclusive hiring practices.
- Faster Time‑to‑Insight
Interactive visual dashboards reduce time spent manually compiling or interpreting reports.
Analytics Dashboards General Availability
Upcoming Release: Analytics Dashboards Across All Products
Planned Rollout: Q1 2026
We’re excited to announce that new Analytics Dashboards will be rolled out across all NEOGOV products in Q1 of 2026. These dashboards are designed to give agencies powerful visibility into their data, helping them make faster, more informed decisions across Human Capital Management (HCM), Workforce Management (WFM), and Talent modules.
This initiative includes an early access period followed by a phased release to all customers.
What’s Coming
Unified Analytics Dashboards
Customers will gain access to modern, consistent, and intuitive dashboards built to provide insights across key business areas. These dashboards help agencies:
- Understand workforce activity and trends
- Measure engagement and performance
- Monitor core HR and talent processes
- Improve decision-making with clearer visualizations
What this means for customers
- Gradual, stable rollout ensures all agencies get access without service disruption.
- The Early Access group will help refine the experience before general release.
- All NEOGOV customers will receive the new dashboards by the end of Q1 2026.
- Documentation, training materials, and in-app guides will accompany each phase.